
Whether you’re an experienced investor or a complete novice, success comes down to a careful balancing of risk and reward. It isn’t always easy to get this balance right and for those new to investing, the worry might even prevent you from starting at all.
Some simple lessons apply whether you’re investing £500 or £500,000 and expert financial advice can help you to get to grips with these key concepts. But you don’t just have to take our word for it.
Keep reading for five simple investment lessons and the graphs that prove them.
1. Short-term volatility is to be expected
When weighing up moving your hard-earned money into an investment, risk will be a huge factor in your decision-making process. Investment market movements over the last few years will likely be at the forefront of your mind.
From the 2008 global financial crisis to the coronavirus pandemic and the global effect of Russia’s invasion of Ukraine (and now the Israel-Hamas War), the last few years have been turbulent for stock markets.
A look at the FTSE All-Share Index since 2004 clearly shows the fallout from Covid and the financial crisis.
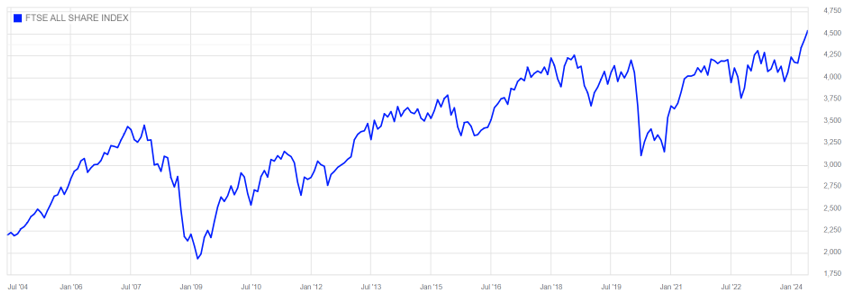
Source: London Stock Exchange (LSE)
Short-term volatility, though, is to be expected.
It’s the reason that your investment is long term in the first place, to ride out these short-term dips and take advantage of longer-term trends.
2. Bull v Bear markets
Markets are in constant flux, with prices changing to reflect every block of shares sold.
When prices rise and fall by a great degree, they are referred to as “bull” or “bear” markets. A bull market (it might help to picture the upward arc of a bull’s horns) occurs when markets rise by 20%. A matching fall, meanwhile, is known as a bear market, possibly due to the downward swipe of that animal’s paws.
The important thing to note, though, isn’t the rise and fall of these markets, but the size and duration of each movement.
This chart looks at the S&P 500 (an index comprising the 500 largest companies on US stock markets) since 1963.
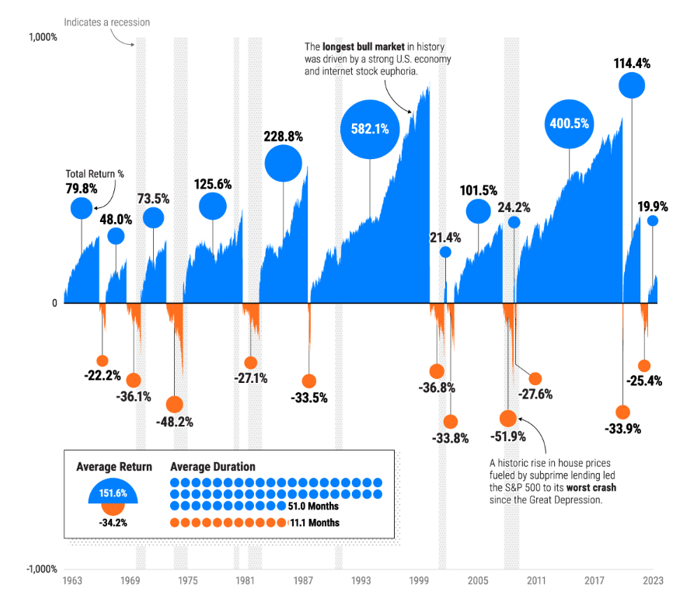
Source: Visual Capitalist
As you can see, the average loss during a bear market is -34.2%, compared to average bear market gains of 151.6%. Bear markets lasted an average of 11.1 months, while bull markets lasted for 51 months.
3. Trying to time the market could cost you
When you have money invested in the stock market, it can be easy to make emotional or knee-jerk decisions. But these can be costly.
As we have seen above, periods of rising prices last longer on average than downward turns. This means that panicking when markets drop and selling your shares could simply turn a paper loss into a real one.
Worse still, you won’t be invested when the markets recover and bullish markets see their best days.
Sticking with the S&P 500 for now, here’s a look at the difference in annualised returns over 30 years, with the market’s “best days” missed.
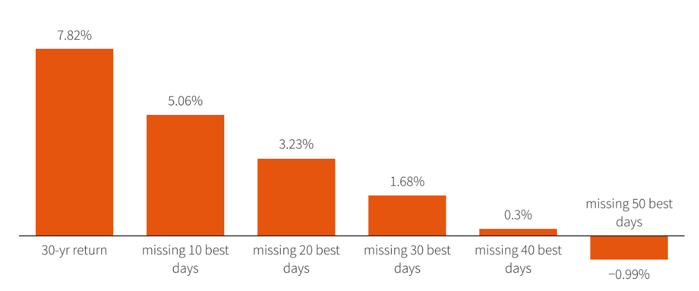
Source: Reuters
The graph shows annualised returns over the 30 years from 1 September 1992 to 31 August 2022.
It makes clear the importance of remaining unemotional and staying invested for the long term, with annualised returns ranging from 7.82% to -0.99%.
4. Focusing on your long-term goal is key
As we have already seen:
- Your investment is long-term to help your money ride out losses incurred during short-term dips.
- These short-term dips are generally shorter than the periods of recovery that follow.
- Missing market “best days” through knee-jerk withdrawal can harm your returns.
Here’s the FTSE 100 since 1964.
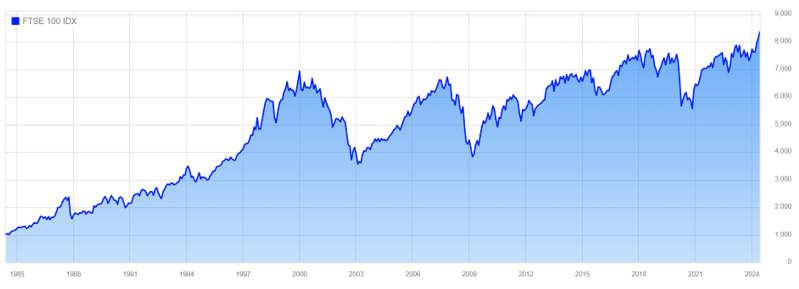
Source: LSE
The overall upward trend of the market is clear, confirming that staying focused on the long-term and ignoring the noise of global events and market movements is the key to reaching your goals.
5. The importance of diversification
One way that the team here at Fingerprint Financial Planning can help you manage your investment is by spreading risk through diversification.
Your wealth will be spread across different asset classes, sectors, and geographical regions. Doing so means that a drop in one area will hopefully be offset by a rise elsewhere. This minimises your exposure to sudden shocks and avoids an over-reliance on a single area.
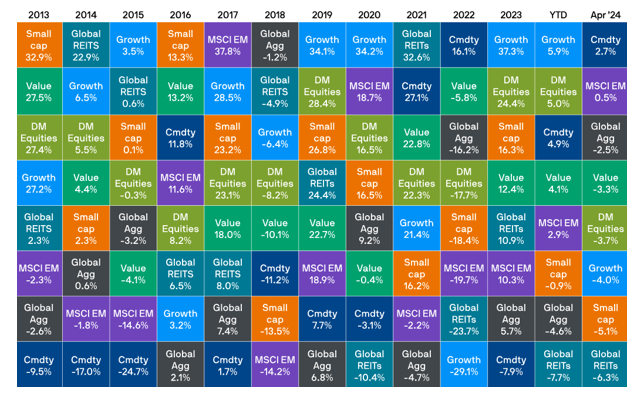
Source: JP Morgan
The above chart shows different asset classes and their performance over the last 10 years. The changing fortunes of each class highlight the benefits of spreading risk.
Get in touch
If you have any questions about your long-term investments, speak to us now. Get in touch by emailing hello@fingerprintfp.co.uk or calling 03452 100 100.
Please note
This article is for general information only and does not constitute advice. The information is aimed at retail clients only.
The value of your investments (and any income from them) can go down as well as up and you may not get back the full amount you invested. Past performance is not a reliable indicator of future performance. Investments should be considered over the longer term and should fit in with your overall attitude to risk and financial circumstances.